Chatbots In The Contact Centre

The SI Guide To Chatbots In The Contact Centre

A major challenge for your clients that have a contact centre, is keeping support costs down. There are myriad costs involved with handling just one query within the contact centre and unfortunately, a large portion of contact that finds its way there is unnecessary. 

In this article, we discuss the importance of the contact centre chatbot for your clients and recommend the best technology for them. 

The Power Of The Contact Centre Chatbot

More than ever, contact centres are investing in customer service chatbots. Of those asked, 48% said they have deployed such technology into the contact centre and this is excepted to grow.


So why are so many deeming the chatbot an essential tool within customer service?As a form of self-service, chatbots provide customers with the power to find the answers they need without having to contact an agent. However for the occasions when agent assistance is required, customers are smoothly escalated to the contact centre where they can receive specialist help.

Chatbots in the contact centre provide value by:

  • Reducing contact centre costs
  • Automating processes through integrations
  • Escalating to the contact centre

Reducing Contact Centre Costs

In the contact centre, routine queries often make up a large portion of overall contact, creating unnecessarily costs for your clients.

Routine queries or frequently asked questions have a fixed answer and therefore don’t require agent assistance in order to resolve. No agent assistance means no handling or labour costs and therefore large savings for your clients.

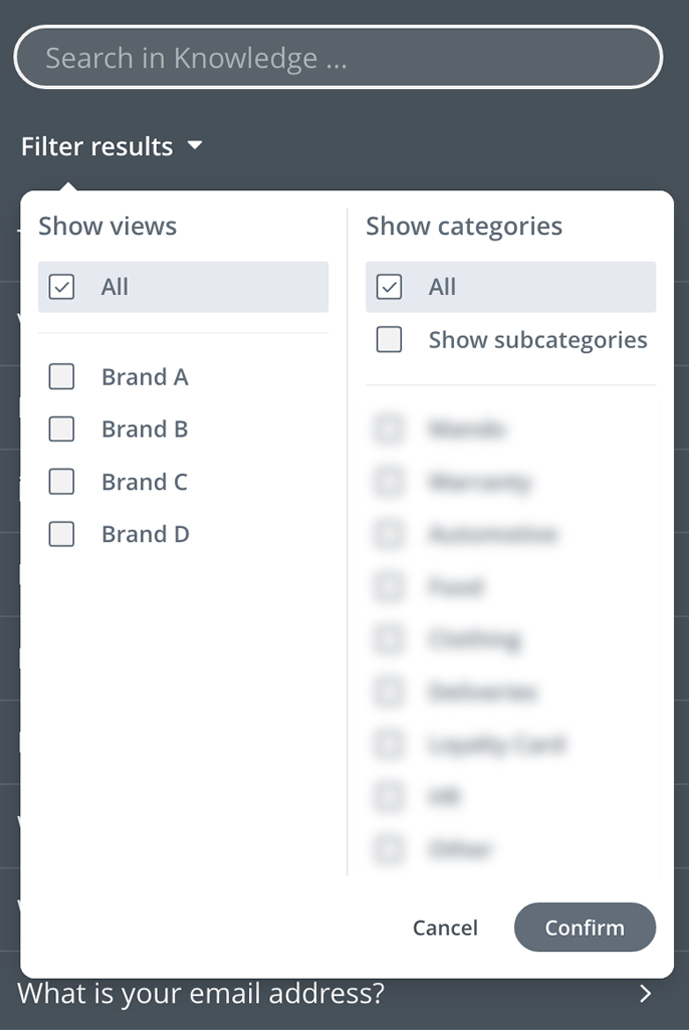
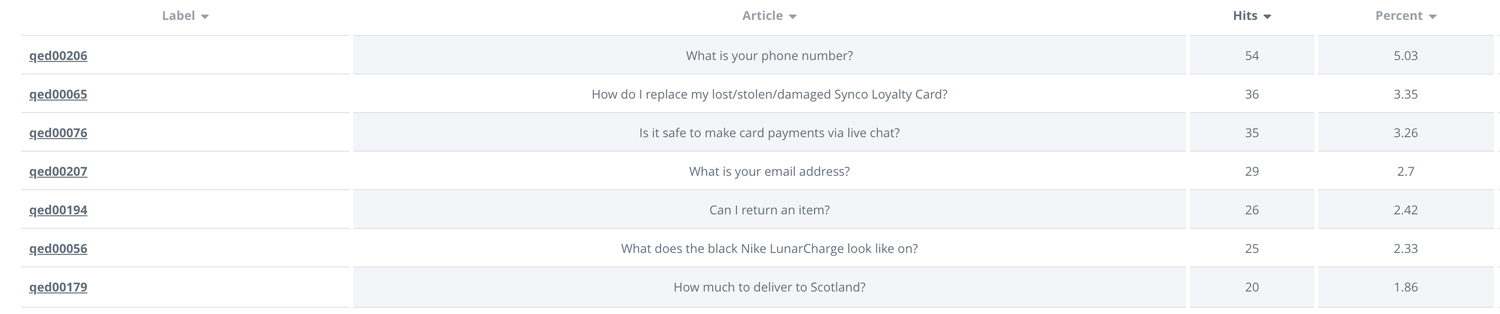
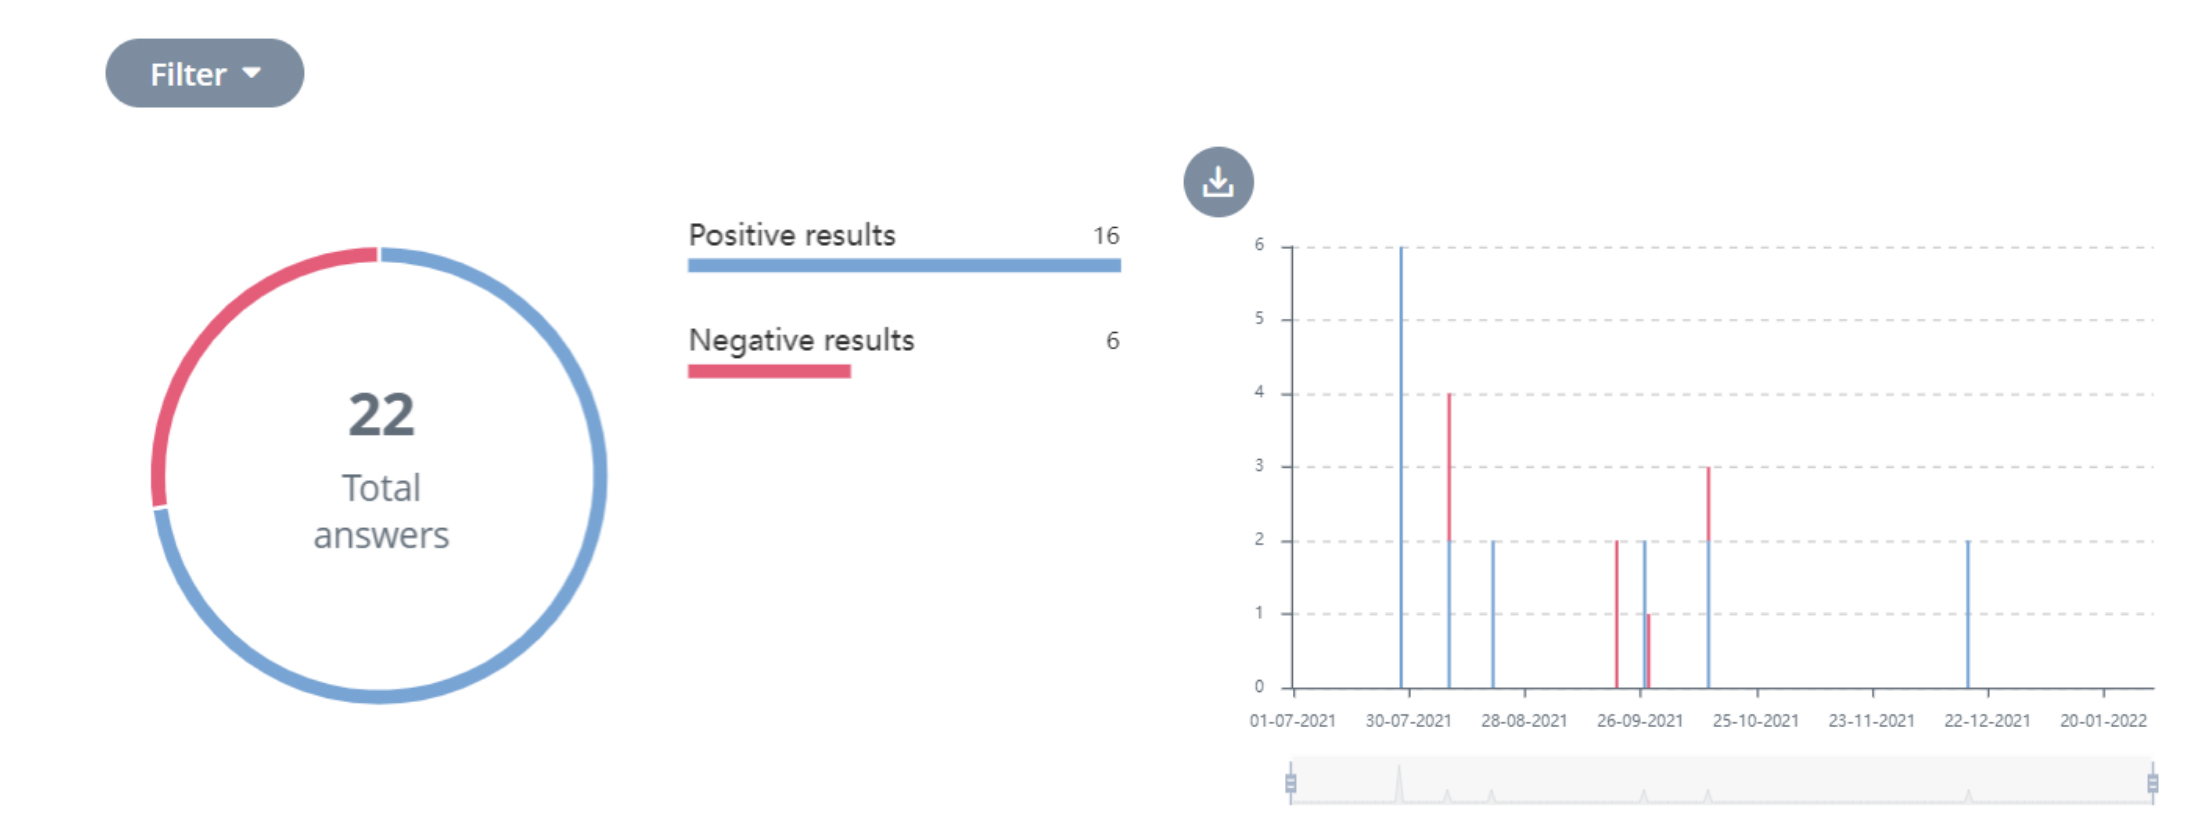
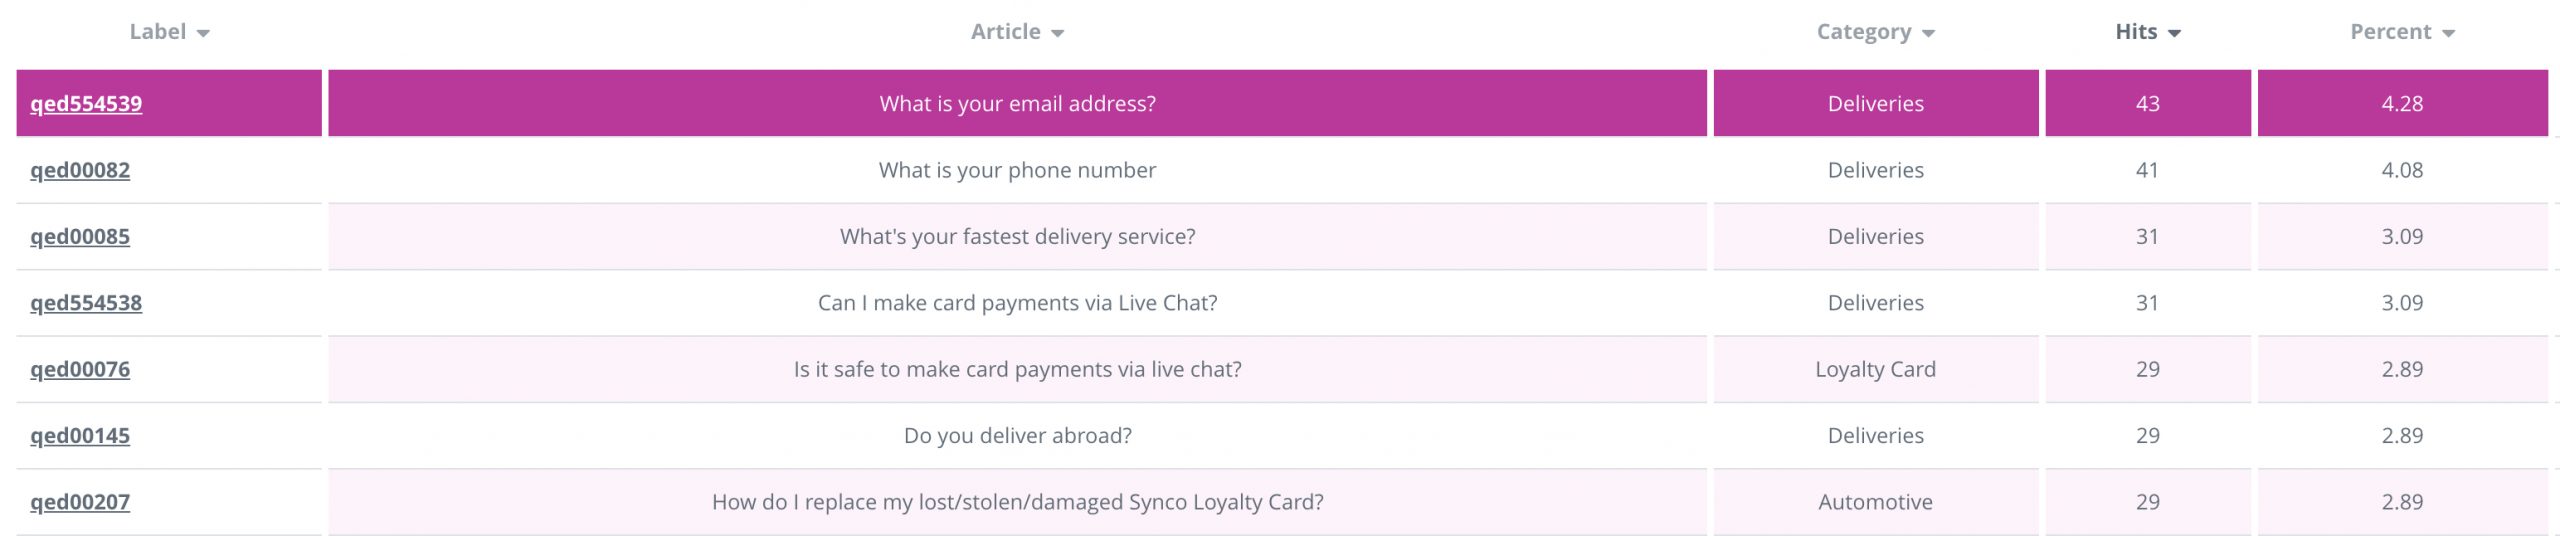
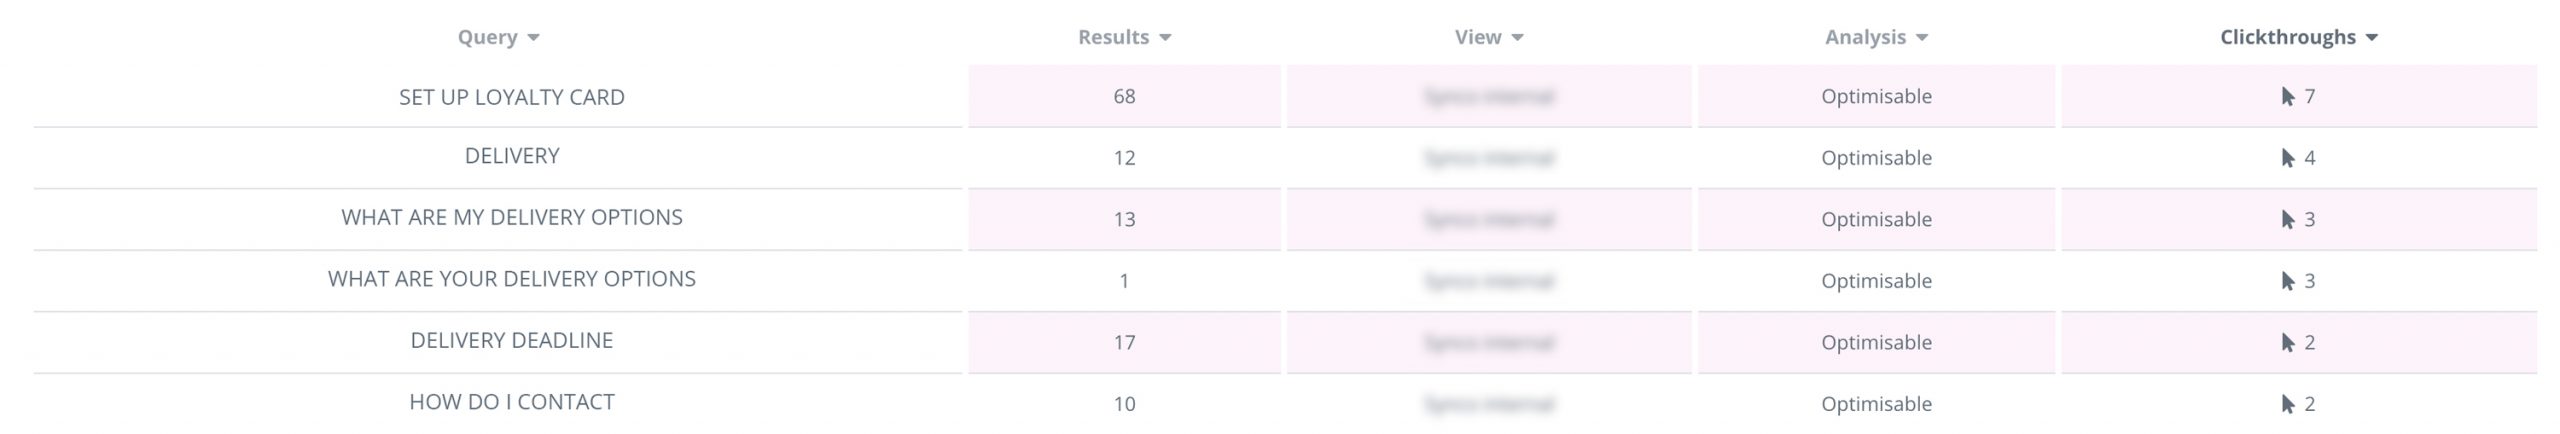
Instead, customer service chatbots, a form of self-service utilise AI and harness sophisticated Natural language Processing (NLP) to handle these routine questions.

When a site visitor types their query into the chatbot, NLP dissects the question, analysing each component including keywords, intent, grammar and popularity. It then compares these elements with the knowledge base and returns the most relevant results to site visitors.

70% experience a reduction in call volumes when chatbots are deployed.

Not only can Synthetix’s customer service chatbot, Xan automate 20% of routine queries independently online significantly contributing to cost savings, but by giving site visitors the tools to find the answers they need by themselves, CX improves for your customers.  

Automating Processes Through Integrations

Chatbots for the contact centre are capable of automating more than just routine queries. A customer service chatbot can guide your clients’ customers through the entire online journey when the correct software is in place. 

Synthetix’s Xan, for example, is built using open RESTful APIs and therefore can connect with a multitude of 3rd party apps – particularly your clients’ most-used business tools – to automate complex customer processes. 

A common process that can be seamlessly automated by Xan the chatbot includes Identification and Verification (ID&V). Traditionally this would involve a customer having to call the call centre and answer questions that would verify their identity. This process was time-consuming and often involved risk in regards to security. 

However, when automated using a chatbot, the ID&V process takes a fraction of the time, lowering Average Handling Times (AHT) and therefore costs. Always PCI compliant, Synthetix’s chatbot integrates with software that hides customers’ details and only shows the agent whether the ID&V process has been successful or not.  

Other processes that can be automated using a contact centre chatbot include: 

  • Quotes and orders
  • Policy admin
  • Mid-term adjustments
  • Payments
  • Order updates

Further with 67% of customers preferring to solve issues themselves, process automation through chatbots is the far more convenient option for your clients’ customers.

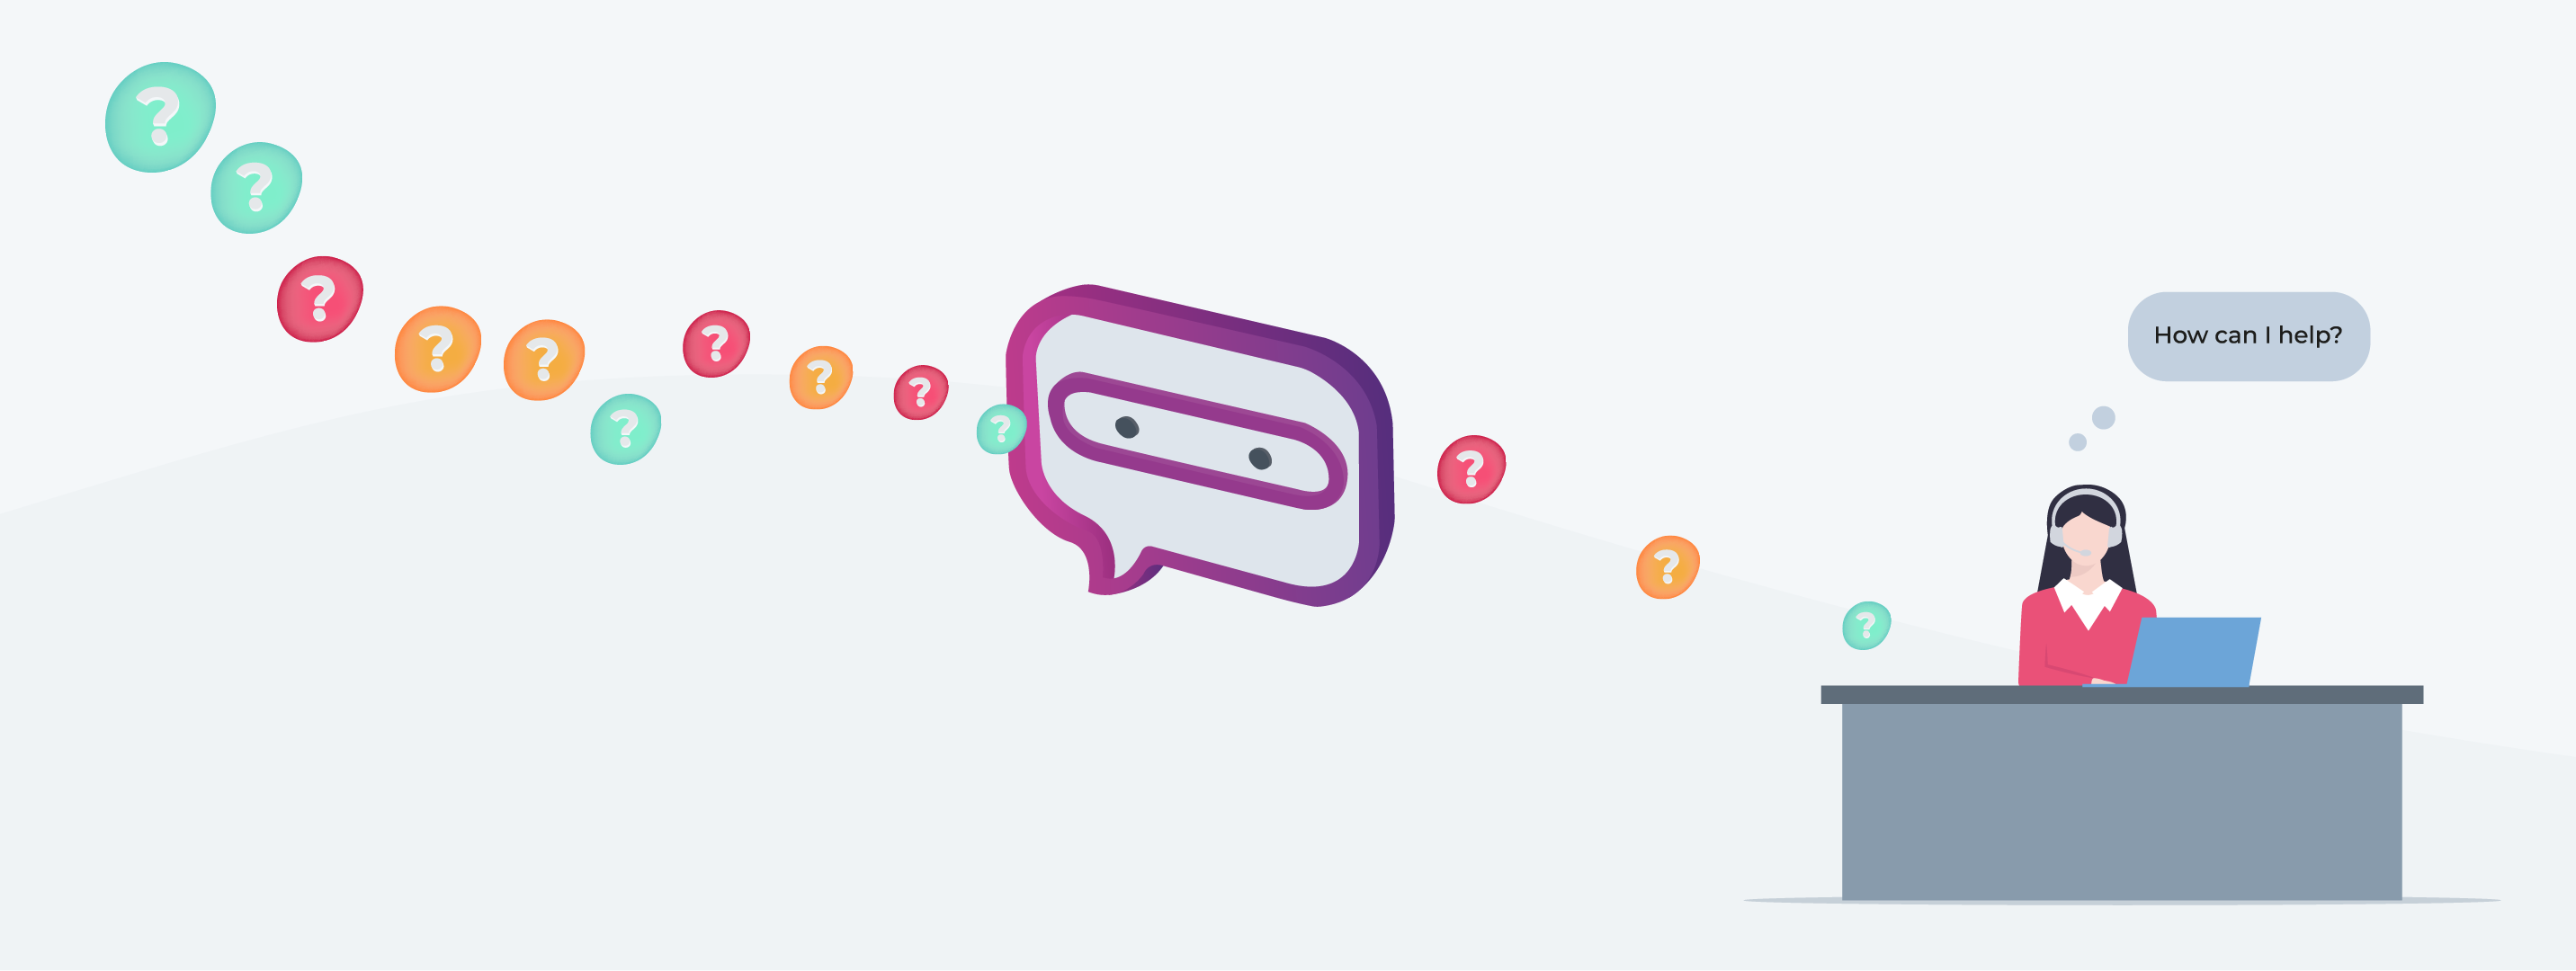
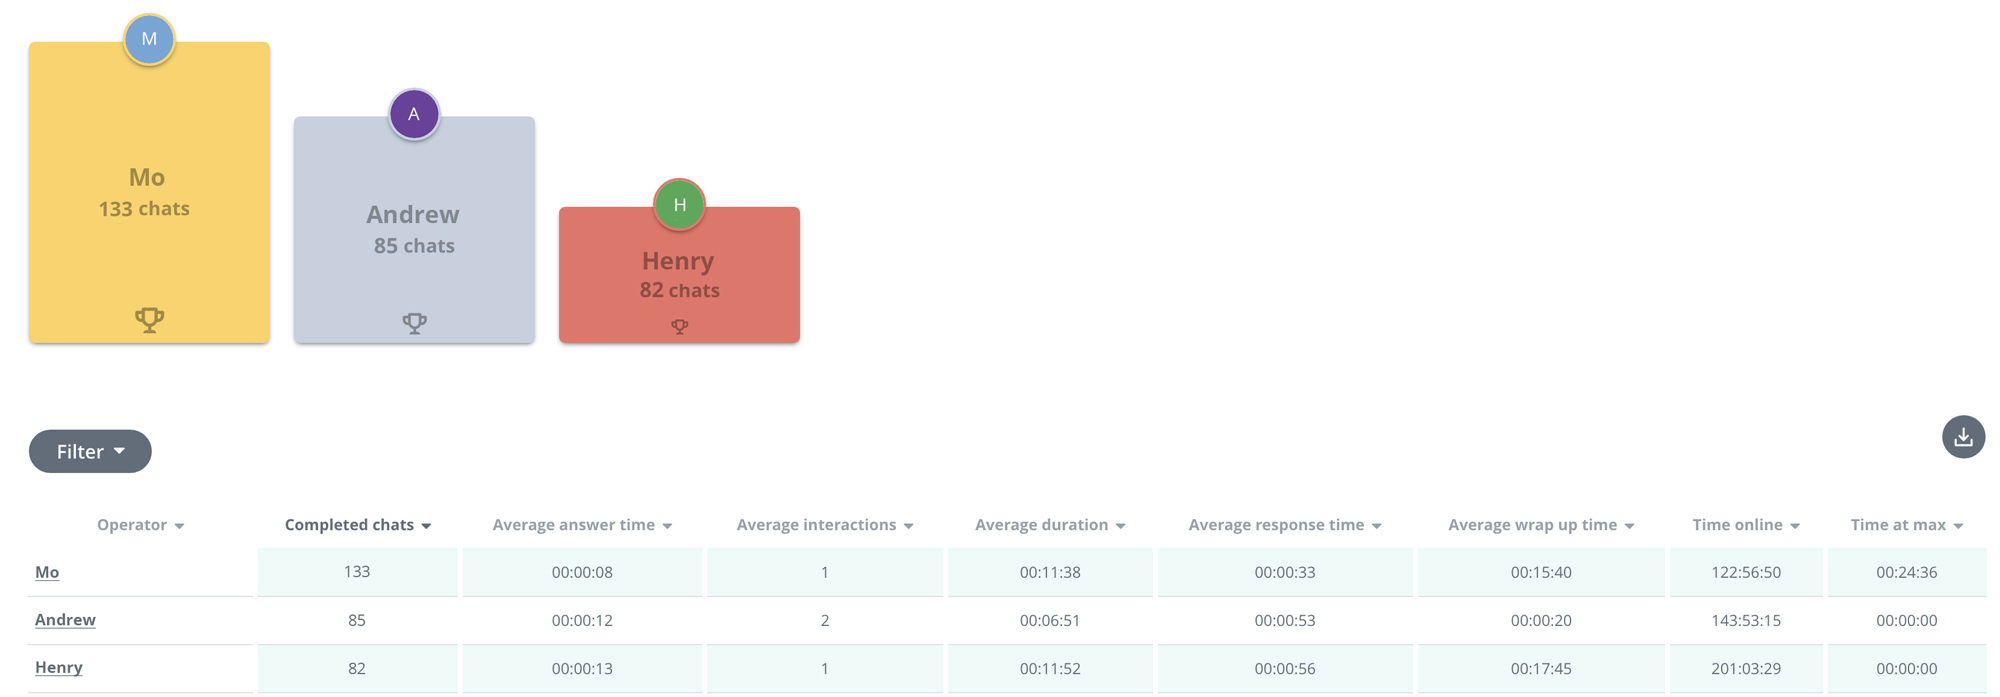
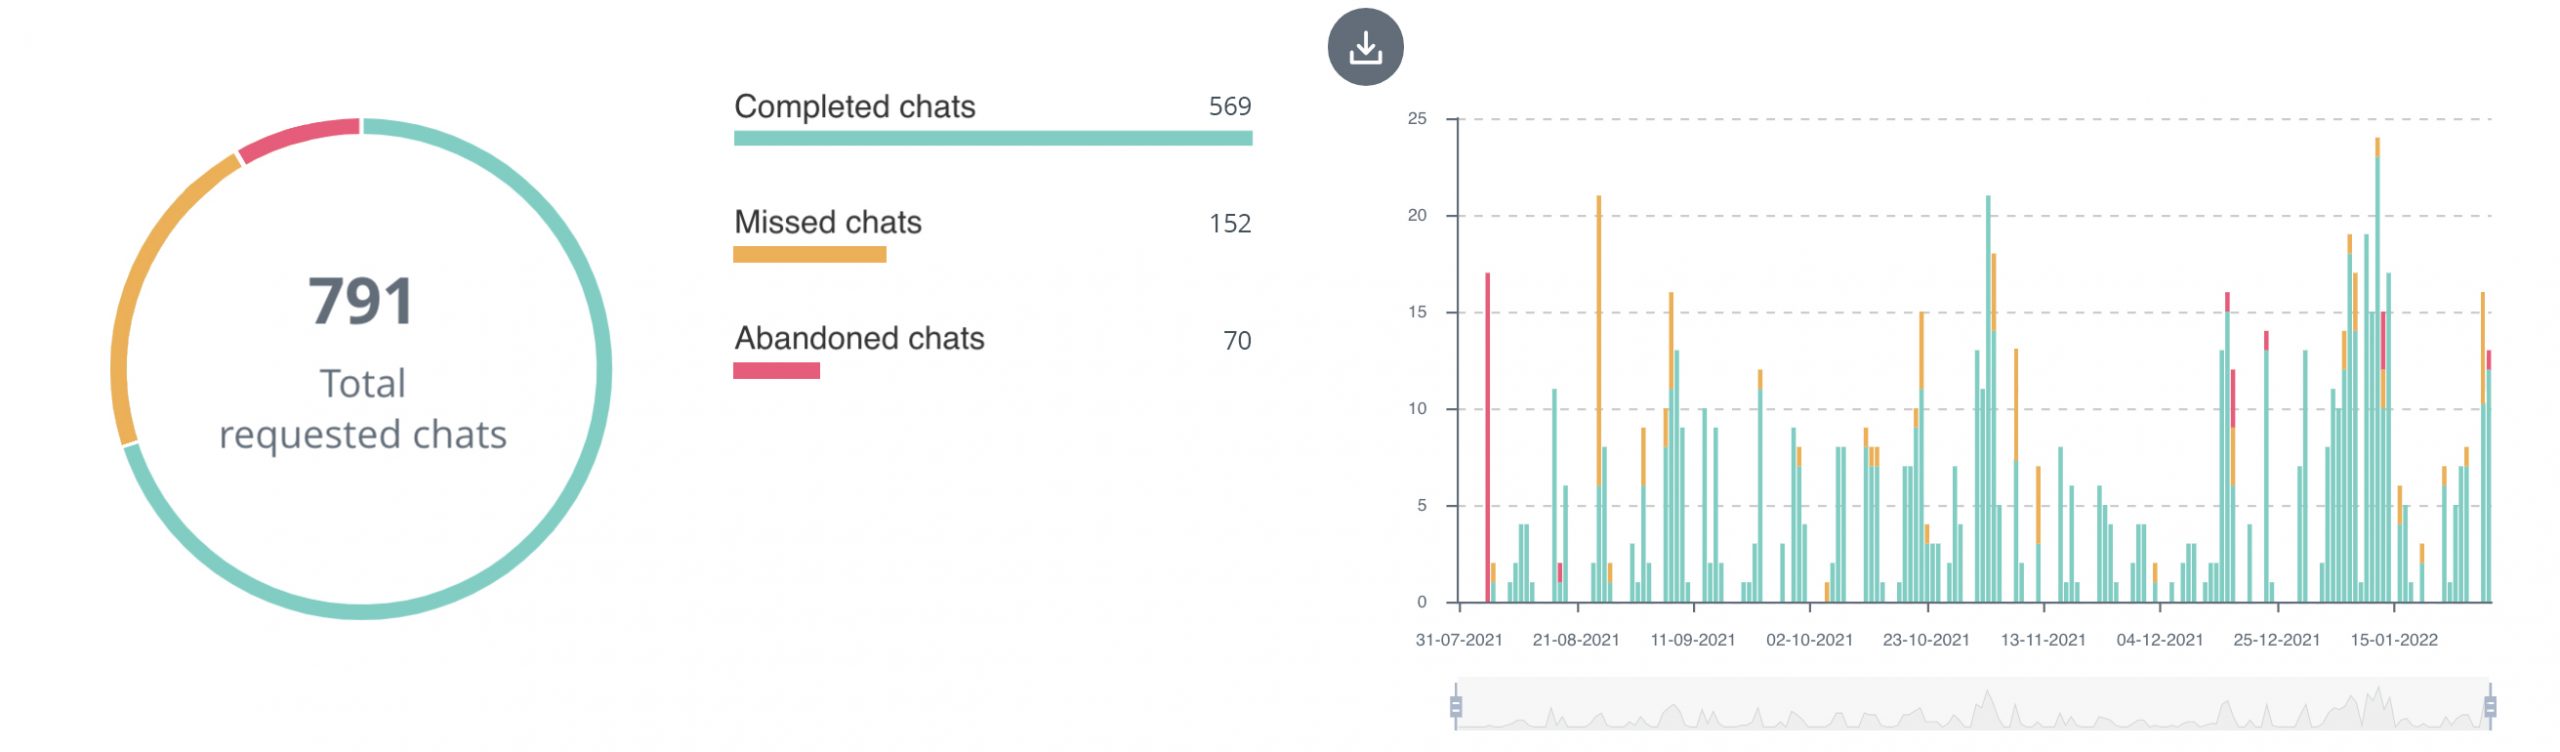
Escalating To The Contact Centre

Whilst chatbots are excellent at helping site visitors self-serve, there will always be occasions where a query is too complex for AI alone to handle. 

But all too often such a scenario creates negative experiences for site visitors; they realise the chatbot cannot solve their issue so must source the company’s contact details where they not only have to wait in line for 30 minutes but have to repeat their query. 

Synthetix’s chatbot, Xan on the other hand, detects when the query won’t be resolved using just AI and automatically escalates the query to live chat. Here it is assigned to an agent with the appropriate skillset along with the original chat transcript to prevent any need for repetition, boosting CX. 

Final Thoughts

If you enjoyed this article and are interested in finding out how Synthetix’s chatbot solution could help reduce your clients’ contact centre costs whilst improving CSAT

How Synthetix Adds Value To Systems Integrators 

How Synthetix Adds Value To Systems Integrators

Synthetix not only specialises in providing enterprise companies with customer service software such as intelligent knowledge bases, self-service software, live chat and customers service chatbot solutions, but it also adds value to systems integrators.

Our Partner Programme was built with system integrators in mind and adds value in a variety of ways:

  • Increases revenue through joint propositions
  • Adds value to current offerings
  • Save customer service costs
  • Ease of partnering
  • Industry specialist with 20 years of experience 

Increases Revenue Through Joint Propositions

Integrations with Synthetix software help to increase new business opportunities for systems integrators, boosting revenue.

Synthetix is known for delivering CX excellence, however, from a systems integrator, when integrated with software they already offer, the whole becomes greater than the sum of its parts. This is because greater value is produced for prospective customers, opening up doors that were perhaps unattainable before.

By combining Synthetix’s CX tools with the existing software that systems integrators are fluent in, systems integrators’ offerings become more attractive to a wider variety of prospective customers. This also gives them the opportunity to remedy deals they had previously lost, win bigger projects and subsequently increase revenue.

If a lead has a certain requirement, for example being able to take payments via live chat and chatbot channels, it’s important you have a customer service software provider that offers flexible RESTful APIs on board. Synthetix, for example, has integrated with many payment providers to automate the process, boosting efficiency and reducing costs.

When systems integrators add Synthetix to their integrations portfolio, they can be assured that clients’ CX needs are fulfilled beyond expectations. 

Adds Value To Current Offerings

Synthetix’s products are built using open RESTful APIs, making the integration deployments particularly smooth. By combining Synthetix customer service tools with the software that your clients already utilise, greater outcomes are produced; operational efficiency increases and clients can do more with their technology.  For instance, if a client finds that large volumes of routine queries are coming through their ticketing system and unnecessarily costing them a lot to handle, an integration with Synthetix’s knowledge software can help.

The integration between your client’s ticketing software and Synthetix allows its visitors access to routine questions without sending a ticket. On each key-press, the site visitor is suggested relevant article based on what is being typed – reducing tickets and therefore support costs.

As a result of such integrations, your customers, who are receiving a far more valuable product, are satisfied and therefore more likely to remain a customer in the long-term. 

Save Customer Service Costs

A growing challenge shared by systems integrators’ clients is reducing their support costs and being able to maintain this. Here are some of the ways in which Synthetix software inherently helps to achieve this:

  • Our self-service software utilises Natural Language Processing (NLP) to automate routine queries and tasks that would otherwise end up reaching the contact centre and cost.
  • The SEO help centre serves answers as early on in the customer journey as search engine results, preventing the need to access a clients’ website to make a call.
  • One central knowledge base powers all self-service tools, agent-assisted channels and the agent interface to ensure the prevention of inconsistent information and repeat contact.
  • Powered by NLP, agents are presented with relevant knowledge articles on each keypress within the agent interface to significantly promote handling times.
  • Within live chat, agents can see what a visitor is typing before they hit “send”, the live key-press feed gives them the opportunity to prepare a resolution as the query is sent, reducing AHT.
  • Synthetix’s comprehensive analytics suite lets you see the effectiveness of each tool and areas in which optimisation may be required.

All of these features are accessible and can be integrated with other technologies to drive further customer service efficiencies.

Ease Of Partnering

Allowing frictionless integrations between Synthetix software and other tools is vital. We like to make things as easy as possible for our partners so have ensured our APIs are open and RESTful, offering any support that is required from our expert team of developers.

Synthetix’s partner portal was built as a one-stop-shop for our partners, with everything in one place to simplify things, including:

  • APIs
  • In-development SDK
  • Training and resources
  • Pricing
  • Reference application 

Further, as an independent company, Synthetix has the capacity to be agile and flexible in order to cater to partners’ needs as well as any bespoke work or adjustments.

Industry Specialist With 20 Years Of Experience

Synthetix has been providing enterprise businesses with customer service software since 2001. We are fluent in CX and know what your end-users require when it comes to customer service.

Over the years Synthetix has become a specialist for industries such as Water Utilities where, for example, we serve 53% of water companies across England and Wales.

From Utilities to Insurance and Retail to Manufacturing, Synthetix understands that CX needs differ from industry to industry. We provide the solutions and support required to ensure clients across industries are satisfied – one Financial Service customer of Synthetix’s has been with us since 2005 (17 years and counting).

Our experience helps your clients feel assured and can even provide leverage during the lead nurturing process. 

Final Thoughts

Partnering with an experienced company such as Synthetix that specialises in customer service software and makes integrations easy can help you win new business and maximise existing revenue streams.

If you’re interested in reaping the rewards of a partnership with Synthetix,

How To Choose The Best CX Partner For Your Business

How To Choose The Best CX Partner For Your Business

Partnering with a CX software vendor helps to maximise the value of your offering, become more relevant to your customers and access opportunities that are otherwise unattainable.

There is a myriad of CX partners to choose from out there but how can you know for sure which is best suited to your organisational needs?

We have identified 5 key questions to consider:

  1. Do they have the capabilities to help you achieve your objectives?
  2. Is their commercial model aligned with yours?
  3. Do they have relevant and adequate experience?
  4. Are they reliable and flexible?
  5. Do they offer a strong yet adaptable technology stack? 

1. Do They Have The Capabilities To Help You Achieve Your Objectives?

It is fundamental that your CX partner thoroughly understands your needs and what you are striving to achieve by joining forces. Not only is it important that they relay this to you but it’s important that they prove their capabilities can you get you where you want to be.

Ensure that any prospective CX partners take you through their skills, experience and competencies. Check the partnership types they offer are in line with what you require. 

For instance, Synthetix offers partnership types such as:

  • System Integrators – Utilising Synthetix’s SDK 2.0 (in development) to combine your clients’ software and subsequently increase value for you and their customers. 
  • Technology Partners – Seamlessly integrating directly with your software to create an enhanced offering for your customers.
  • MSPs – Multi-tenant knowledge base views enable the management of multiple clients’ customer services within a contact centre – perfect for outsourcing. 

2. Is Their Commercial Model Aligned With Your Requirements?

To ensure you and any potential CX partners are aligned commercially, consider the following:

  • Is the pricing structure compatible? Do they offer commercial models that are suitable for enterprise business, bespoke needs and multi-year contracts? 
  • Are their client bases similar to yours? Joint offerings could broaden your appeal to the wider market but large discrepancies in the audience would simply not work. 

3. Do They Have Relevant And Adequate Experience?

Do your research with regards to potential CX partners and their experience – particularly with projects that are similar to what you’re asking for. Forging a partnership with a company that doesn’t have the relevant experience is risky and not recommended. 

Look for the following: 

  • The number of years of experience – Although quality over quantity may be true, years of experience is a good  indicator of how well a vendor can execute a partnership. Synthetix has been delivering CX solutions and partnerships since 2001. 
  • The industries in which they have experience – Make sure they have experience in your given industry. Synthetix for example, has worked within a multitude of industries from Utilities to Manufacturing and Retail to Contact Centres. 
  • Their track record with previous projects – Do they have any case studies outlining project examples and wins? If not can they demonstrate this to you in another way? Such examples are proof of capability. 

4. Are They Reliable And Flexible?

A fundamental when partnering with a CX vendor is reliability and flexibility. You don’t want to get midway through an important project to find out that the lack of security, support or willingness to go the extra mile hinders its completion. 

Ensure you ask directly or find out through desktop research the following: 

  • Security: First consider your security needs, they may be different per project but this first step is crucial. Ensure the CX partner complies with these and at the least: ISO 27001, GDPR and PCI.
  • Support: Discuss in detail the level of support required and expected from your end, making sure both partners are on the same page. If expectations are not managed here then things begin to collapse. For instance, you may require certain hours of available support per day as well as an experienced account manager on hold.
  • Flexibility: To find out if a prospective partner would go above and beyond, ask directly. Suggest a hypothetical scenario and see what they say. Alternatively, you can look for success stories or testimonials online.

5. Do They Offer A Strong Yet Adaptable Technology Stack?

Firstly know exactly what you require from a partner in terms of technology and how it will tie into you and your clients. It’s paramount that this fit is assured from the get-go otherwise the partnership will not work as intended: 

  • Make sure your potential CX partner has taken you through a thorough product demo and explained in detail how the technologies will work together. 
  • Find out their integration capabilities – Are their APIs open and RESTful? Can their software connect with any 3rd party apps that are integral to the project’s success? 

Final Thoughts

When it comes to delivering excellent CX and customer service, often “the whole is greater than the sum of its parts” is all too true.  

If you are looking for a CX partner that is experienced, understands partnership needs, is reliable, flexible and knows the importance of commercial and technological adaptability, please 

How To Use CX Software In The Multi-Tenant Contact Centre

How To Use CX Software In The Multi-Tenant Contact Centre

Synthetix’s complete online CX solution helps contact centres that handle multiple brands’ customer service. Unlike other CX providers offer multiple knowledge bases to serve multiple clients, our centralised knowledge base utilises “views” which allows multi-tenant contact centres to serve multiple brands’ simultaneously. 

Knowledge Base 

Synthetix’s internal knowledge base solution, Knowledge: For Your Team helps contact centre agents seamlessly deal with multiple companies’ customers simultaneously.

For instance, if you handle five companies’ customer service, you would only require one knowledge base but within that knowledge base, you would create five separate views, each dedicated to a company.

A view is a specific set of knowledge articles that are targeted towards a certain audience. For instance, Brand X supply you with a library of popular questions and answers. These are transformed into knowledge articles that make up a view that you call “Brand X agent view”. The same occurs with Brand Y and Brand Z whose customer service operations you look after.

It is likely that once an agent has finished dealing with one customer’s query, the next customer they talk to will be from a different brand. It is therefore vital in terms of maintaining efficiency and keeping handling times down, that switching between views is quick and easy.

With Knowledge: For You Team, switching from one view to another is as simple as ticking a box. Simply navigate to Knowledge inside the agent interface, choose the Search function and use the filter to choose which view you would like access to.

An image showing the different types of views for Internal Knowledge

To assign a knowledge article to a specific view, simply tick the view when publishing. 

View-Specific Decision Trees

Knowledge: For You Team also lets you create decision trees that are specifically targeted to one brand.

Synthetix’s decision tree technology uses a drag-and-drop, flowchart-like approach to provide agents with comprehensive step-by-step instructions for when a query has variables and more than one possible outcome.

This is particularly useful for agents that deal with multiple brands. There will be troubleshooting protocols to follow that are very different per company. Simply switching to the appropriate view allows them access to the relevant answers.

New agents also benefit from view-specific decision trees. Starting as a new agent at a contact centre that deals with not one, not two but multiple companies’ customers can be daunting and confusing. However, decision trees simplify the troubleshooting process by giving agents step-by-step scripts as to how to handle certain issues. All the agent needs to do is filter by the view and type in the query.

To create a decision tree, open up Editor and choose “Open Decisions”. From here you can either choose an existing article or create a new decision tree, filtering by view.  

Live Chat

In the multi-tenant contact centre, not only does one centralised knowledge base power multiple views but Synthetix Chat gives agents the ability to take chats from different brands’ within the same queue, meaning there is no need to have multiple logins.

Synthetix software detects where each individual chat has come from. Admin can assign particular clients to particular agents. Alternatively, agents can switch between views depending on the customer – they will be notified as to which client they belong to. 

Self-Service

If you are managing a company’s complete customer service, it is important to consider self-service and how customers find their own resolutions online. Including self-service tools such as an FAQ widget and chatbot helps to reduce the total volume of routine queries that reach the contact centre. This gives your agent the bandwidth to help those with complex issues, impacting CSAT. 

FAQ Software

Just as Synthetix’s knowledge base equips your agents with a whole library of information (the view), it can also fuel your online FAQ tools. Knowledge: For Your Customers takes a specific view from the knowledge base and powers the FAQ widget and SEO help centre that resides on a company’s website.

Because the FAQ tools are public-facing, you may wish to use a limited version of a client’s view. For example, you have Brand X agent view for agents to work from and Brand X customer view with limited information – particularly more routine queries – for customers to self-serve from.   

Chatbot

In addition to Synthetix’s intelligent knowledge base, multi-tenant contact centres adopt multiple chatbots to take care of customers that wish to self-serve on client websites.

Synthetix’s customer service chatbot, Xan is powered by the same, centralised knowledge base that powers your agent interface and other self-service tools. You can choose which view you assign to particular chatbots (Brand X customer view for example) as well as brand configuration.

With control over CSS, you can match elements to brand guidelines. Whether it’s colour, font, logos or formatting, Synthetix’s customer service chatbot, Xan adapts to match a company’s branding.

Synthetix also offers an additional search layer, Jabberwocky, that gives companies some control over the chatbot’s personality. By configuring certain responses, conversational quirks and idiosyncrasies can be injected to channel a brand’s personality further.

Knowledge Management Best Practice Guide

Synthetix Knowledge Management Best Practice Guide

Why Metrics Are Key To Knowledge Management

You can’t improve what you can’t measure. The capability to interpret knowledge management data and subsequently make key decisions based on what is found is paramount to business efficiency. 

External Knowledge Metrics

Once an article has been published it is good practice to regularly evaluate its effectiveness. Wait an appropriate amount of time so that there is sufficient data to analyse. This will depend on the nature of your analysis, and sometimes you have to work on low levels of data, but if you can, wait until you have confidence in your sample size.

Navigate to the Metrics section of your account, choose External Knowledge and access the following reports:

These reports pull data on the usage of content from both FAQ tools and bots – you can filter by product at the top of the page. 

Visitors

Choose your instance, product and date range to see visitor data.

Visitors shows you the total number of new and returning visitors that used your FAQ or chatbot software over time. Use the pie of bar graph for data at a glance or the table for a breakdown of daily visits per new and returning.

Using the Visitors reports help you to identify high traffic spikes that can be an early warning sign there is a fatal issue with your product/service. 

Use Case

You notice a sudden spike in visitors so you check the Top Articles report. Here it tells you that there has been a spike in clicks to the “What is your returns policy?”, signalling that there could be an issues with your product affecting the masses. You investigate further from here.

A chart showing visitors to External Knowledge

Interactions

Choose your instance, product and date range to see interactions data. 

This report shows you the most popular times and days in which your visitors use your tools. Presented in a grid format, you can filter by day to get a more granular breakdown of peak hours. 

This report helps to show you the effectiveness of your FAQ and chatbot technology. It outlines time periods in which many interactions occur – interactions that would otherwise reach the contact centre and cost significantly more to handle. 

A graph showing Interaction for External Knowledge

Top Categories

Choose your instance, product and date range to see top category data.

You can add categories to the report to see which received the most visitors over time whilst looking out for intelligence.

For instance, if you notice any irregular fluctuations in this report, for example, one category that usually has little traffic, suddenly spikes, you can use this data as guidance.

Perhaps something externally has occurred that affects you and your business, creating an influx of traffic to a specific article/s within a category. The same applies internally if you have an internal employee knowledge base for your company. 

Use Case

You notice that the category “Faults” has unusually high traffic. To investigate further, you look at Top Articles and see that the article, “What shall I do if my product is faulty?” also has unusually high traffic, signalling that you have a faulty product. You investigate this further with the Product team.

A graph showing Top categories in External Knowledge

Top Articles

Choose your instance, product and date range to see top articles data.

Top Articles reports show you how many clicks each article has received over time. Similar to the Top Categories report, you can select different articles to appear within the graph.

If an article has had little or no visitors it is good practice to:

  • Revisit the article in Editor. Make sure the article title matches the intent of the FAQ.
  • Consider if the article is in fact an FAQ, if it continues to receive no visitors perhaps it is no longer relevant to customers.

The report also provides you with an insight into your customers’ behaviour and what they need help with. This in turn can help inform a better CX.

Use Case

You notice that one article in particular “What is your phone number” is consistently receiving the most hits. If a customer is having to use self-service to find a phone number, the CX is not particularly smooth. Therefore you make it a priority to include the phone number in more visible places across the site.

A graph showing the top articles for External Knowledge

Choose your instance, product and date range to see feedback data. This is where you can find what your site visitors have been using your FAQ and chatbot tools to search for.

This is particularly useful in optimising your content. It helps identify areas for improvements as well as new articles that should be built based on top search results.

Use Case

Having looked at your Search Results table, you notice that “set up loyalty card” has the most hits. You don’t currently have an FAQ that explains how to set up a loyalty card and therefore create one to improve CX.

A graph showing top Search Results for External Knowledge

Feedback

Choose your instance, product and date range to see feedback data. This is where you will find the ratio between positive and negative feedback, the articles that received positive/negative feedback and comments as to why (if a user has chosen to leave feedback).

This report helps you see which articles may include irrelevant, unclear or inaccurate information and therefore need improving.

Use Case

For instance, you check the report this week to find that the article with the most negative feedback is a popular FAQ. You check the comments that mention more than once that the link inside does not work. There was an error that was identified and can easily be fixed.

A graph showing feedback in External Knowledge
A graph showing Feedback Comments for External Knowledge

Internal Knowledge Metrics

Where your External Knowledge metrics help to identify how website visitors are behaving and interacting with your FAQ tools, your Internal Knowledge metrics differ. They help to demonstrate how agents are interacting with the knowledge base whilst serving customers. Internal Knowledge metrics also help to monitor agent performance and usage of tools. 

Analysing internal knowledge metrics helps to understand what exactly operators are helping customers with whilst measuring performance and contact centre efficiency helps inform decisions based on CX, HR and training. 

Navigate to the Metrics section of your account, choose Internal Knowledge and access the following reports: 


Operator’s Summary

Choose a date range to see operator’s summary data. This is where you can see operators’ performance at a glance.

Leader board data shows us the top-performing operators – those that have completed the most searches during a time period. This leader board data is available for agents to see so that they know how their performance compares with others.

A more detailed breakdown of operators’ performance can also be viewed like a scoreboard using filters to quickly find individual data. This is where you can see the total searches, interactions and time spent online per agent.

Operator’s Summary helps you harness agent efficiency.

Use Case

Once you have defined what good performance looks like, you identify that Mo matches that criteria. You ask Mo to take you through his methods to find out exactly what he is doing so well so that this can be applied to others.

A graph showing operators summary in Internal Knowledge

Top Categories

Choose your instance, product and date range to see top category data.

You can add categories to the report to see which received the most visitors over time whilst looking out for intelligence.

For instance, if you notice any irregular fluctuations in this report, for example, one category that usually has little traffic, suddenly spikes, you can use this data as guidance.

Perhaps something externally has occurred that affects you and your business, creating an influx of traffic to a specific article/s within a category. The same applies internally if you have an internal employee knowledge base for your company.

Use Case

You notice that the category “Faults” has unusually high traffic. To investigate further, you look at Top Articles and see that the article, “What shall I do if my product is faulty?” also has unusually high traffic, signalling that you have a faulty product. You investigate this further with the Product team.

A graph showing Top categories in External Knowledge

Top Articles

Choose your instance, product and date range to see top articles data.

Top Articles reports show you how many clicks each article has received over time. Similar to the Top Categories report, you can select different articles to appear within the graph.

If an article has had little or no visitors it is good practice to:

  • Revisit the article in Editor. Make sure the article title matches the intent of the FAQ.
  • Consider if the article is in fact an FAQ, if it continues to receive no visitors perhaps it is no longer relevant to customers.

The report also provides you with an insight into your customers’ behaviour and what they need help with. This in turn can help inform a better CX.

Use Case

You notice that one article in particular “What is your customer service email address” is consistently receiving the most hits. If a customer is having to ask an agent for the customer service email address, the CX is not particularly smooth. Therefore you make it a priority to include the email address in more visible places across the site.

A graph showing the top articles in Internal Knowledge

Search Results

Choose your instance, product and date range to see feedback data. Here you can see the queries that your agents have been typing into the internal knowledge base when helping customers via live chat or telephone to solve queries.  

This is particularly useful in optimising your content. It helps identify areas for improvements as well as new articles that should be built based on top search results. 

Use Case

Having looked at your Search Results table, you notice that “set up loyalty card” has the most hits. You don’t currently have an FAQ that explains how to set up a loyalty card and therefore create one to improve CX.

A graph showing the top search results in Internal Knowledge

Live Chat Metrics

Live Chat metrics contain a number of reports that help create a clear idea of how live chat is performing online, how it can be improved, how customers are using it and how agent performance can be optimised. 

Navigate to the Metrics section of your account, choose Live Chat and access the following reports: 

Operator’s Summary

Choose a date range to see operator’s activity data. This is where you can see operators’ performance at a glance.  

Leader board data shows us the top-performing operators – those that have completed the most searches during a time period. This leader board data is available for agents to see so that they know how their performance compares with others. 

A more detailed breakdown of operators’ performance can also be viewed like a scoreboard using filters to quickly find individual data. This is where you can see the total searches, interactions and time spent online per agent. 

Operator’s Summary helps you harness agent efficiency. 

For instance, once you have defined what good performance looks like, you identify that Mo matches that criteria. You ask Mo to take you through his methods to find out exactly what he is doing so well so that this can be applied to others. 

A graph showing the top chat operators

Chat Activity

Choose a date range to see chat activity data. This is where you can find the data that tells you over time, how many chats were: 

  • Completed: Once the customer has left, the agent completes the wrap-up and marks it completed. 
  • Missed: The agent does not take a chat and the customer leaves. 
  • Abandoned: The customer leaves the chat unexpectedly without a resolution being reached. 

By comparing the number of completed chats and the number of missed chats against what you have deemed normal, you can put measures in place to make sure customer queries are being dealt with. 

Use Case

For instance, you notice that the number of missed chats are higher than what you consider a normal rate. You decide to first check-in with the agent to assess whether any technical problems are occurring. Otherwise, you assign more agents to days where missed chats are high due to capacity issues.

A graph showing chat activity

Operator’s Activity

Choose a date range to see operator’s activity data. This is where you can see the total agents that were logged in over a period of time vs how many of them were engaged in chats during this period of time.

This report is useful in projecting staff and demonstrating how much live chat is used.

Use Case

For instance, you notice a large gap in the data between agents logged in and chats taken which indicates that too many agents were available on that particular day. This can help with the more efficient projection of live chat staff.

A chart showing chat operators activity

Feedback

Choose a date range to see feedback data. This is where you will find the ratio between the positive and negative feedback left by customers. This gives insight into the overall customer experience, agent performance and resolution effectiveness.

You can view the data at a glance, as a timeline and explore feedback further by viewing any comments that customers lefts after the chat ended. This feedback helps to identify any potential issues/wins and ways in which they can be solved/ harnessed. 

Use Case

You notice that one particular agent has consistently been receiving excellent feedback celebrate this, asking them to share some tips with the rest of the team.

Conversely, if an agent is receiving consistently poor feedback, this is something to be investigated.

A chart showing chat agents feedback

Chat Capacity

Chat Capacity metrics demonstrate live data and therefore don’t require the selection of a specific date range. Here you will see in chat slot capacity in real-time and how close you are to maximum slot capacity. 

Use Case

For instance, if you have 10 agents logged in, each with 2 slots the total maximum capacity is 20 chats. You see that the slot capacity nearing 20 and consequently assign more slots or agents in order to fulfil demand.